Having completed several Trackman Combine tests and plenty of Skytrak SA (Skills Assessment) I thought it would be interesting to see how they compare.
Trackman presents you with various targets (60, 70, 80, 90, 100, 120, 140, 160, 180, Drive). All targets are based on carry distance and based on proximity to the target you are given a score out of 100. They than map the score to a handicap based on real data collected from people completing the combine test.
http://blog.trackmangolf.com/performance-of-the-average-male-amateur/
http://mytrackman.com/media/5df25dca-3bc5-41b5-bca8-c3badebdd3b7/content/5_
https://mytrackman.com/media/9e613e61-a366-49cf-8b6f-26c9809c1fc9/CWsVnw/PDF/1.%20TrackMan%20Golf/2.%20Combine/TrackMan-Combine-brochure.pdf
Trackman does not show the calculated handicap for an individual shot.
Skytrak SA is similar although the distances are based on Total Distance as opposed to carry. If you are using Premium balls and hit the ball consistently your spin rate will be high enough for the difference to be negligible (the ball will stop dead or spin back slightly on the Skytrak Green). Each shot is assigned a dynamic handicap based on proximity to the target.
Having completed 3 combine tests and numerous SA's it is immediately apparent the SA is way more punishing for my ability. My combine scores have ranged between 70-78 which places my Trackman handicap between 0-4. My SA scores have placed me between 5-13.
I therefore set about comparing proximity to calculated handicap to see what patterns emerge:


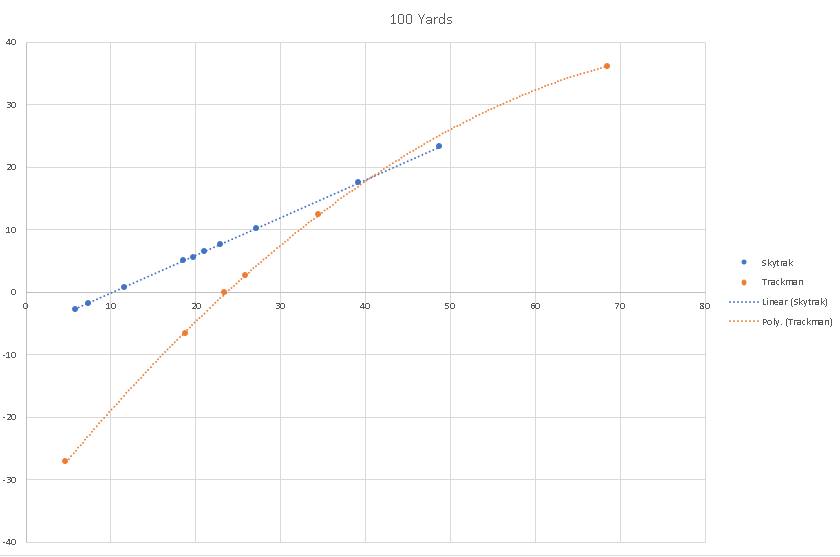


Some very clear patterns emerge:
- Skytrak uses a linear equation to calculate handicap from proximity to target.
- Trackman uses a quadratic equation to calculate handicap from proximity to target.
- Skytrak and Trackman roughly agree in the 18-20 handicap range.
- Below 18 Skytrak becomes increasingly punishing compared to Trackman.
- Above 20 Skytrak becomes increasingly lenient compared to Trackman.
The following chart compares proximity to handicap at varying distances.

From this it becomes even clearer how punishing Skytrak is to better scores. A male scratch golfer will on average score 72 on trackman. He will score a dynamic handicap of approx 8-9 on Skytrak! Because the handicaps converge in the 18-20 region it seems logical the handicap region between 8 and 20 is compressed on Skytrak compared to Trackman (12 handicap units vs 20). This means a 1 shot improvement between 8-20 equates to a real world improvement >1 shot. It also means attaining a 1 shot improvement <8 Sh Hcap becomes exponentially harder compared to Trackman and thusly real life. The Sh Hcap is still in beta (as of 2.5.4) so in my opinion it seems sensible to adjust the algorithm to take this into account.
Conversion
Using this data and excel it is possible to ascertain conversion equations between the systems:
Th - Trackman Handicap
Ts - Trackman Score
Sh - Skytrak Handicap
Trackman Handicap from Trackman Score
Th = -0.0052Ts2 - 0.1572Ts + 38.226 (r2=0.9952)
Skytrak Handicap from Trackman Handicap
Sh = 0.0077Th2 + 0.4029Th + 8.5378 (r2=0.995)
Trackman Handicap from Skytrak Handicap
Th = -0.0254Sh2 + 2.5073Sh - 19.453 (r2=0.9932)
Hi there,
ReplyDeleteI came across your blog and find yours very helpful.
I am very interested in your handicap explanation for Trackman Combine. 72 is exactly a scratch score in golf so I'm wondering if let's say someone scored 55 on Combine, the handicap should be 72-55 = 17 (if done simple calculation) and if you score 80 then someone should be 72-80 = -8? I've seen some 90 scores on Combine so I'm wondering how you want to calculate other scores too.
Thanks in advance.
Trackman doesn't appear to be a linear mapping so using the equation above a score of 55 equates to a handicap of 13.85. A score of 90 equates to a handicap of -18.042!
ReplyDeleteThanks for your reply. One confusion: Are you applying your equation (55 score = 13.85) with your equation or my equation in the reply? I'm not math geek enough to understand what you wrote in your article for Conversion with equation to get a handicap for Trackman Combine.
DeleteI used my equation which I derived from Trackman data. Excel did the hard work in working out the equation!
ReplyDeleteAwesome! can I have that equation so I can fill out my Combine number to see my handicap whenever I finish a session then? I obviously would do more Combine tests that's why.
DeleteThanks!
It is in the text above under the heading 'Trackman Handicap from Trackman Score'
DeleteThanks a lot. Worked well!
DeleteGreat post, do you have the equations for the individual graphs? I'm curious to play around with the data. I estimated some of the Trackman data on the 160 yard shot and found that linear really isn't that bad of a fit either if it's fit right. A curve for SkyTrak would be great but it's more the problem that the slope SkyTrak uses is completely out of wack. If for example the SkyTrak used a line that intersected in two places with the Trackman curve, where it currently does and where the Trackman curve intersects with the y-axis, then it would be a whole lot less off (and probably a reasonably acceptable amount) between those two points as well. Some of the points way out on the 30 handicap side might be more off with that change but if you're that high you probably aren't at the point where you'd spend the money on a SkyTrak yet so I'd argue the 0-20 range is more important to be close on.
ReplyDeleteNot specifically, but the source file and data can be found here so you should be able to extract the graphs:
ReplyDeletehttps://1drv.ms/x/s!AtooZYq7lKxzgSasjKvkI2zBIu2-
That's even better, thanks!
DeleteI fit your data from Trackman to a 3D surface with zunzun.com. This creates an equation where you input any target and proximity and it will output a handicap. For the fit I only used data that was a realistic handicap (between 36.4 and -10 aka +10). Results that produce a handicap outside this range may not fit your data as well. Also targets outside of the 60-180 yard range may not apply since there was no data outside this range to fit to but I believe any target in between 60-180, even those not with specific data points will have fairly accurate results.
ReplyDeleteThe most elegant choice for an equation was the Inverse Paraboloid With Offset. This only required two constant coefficients in addition to Target and Proximity while still having RMSE of 0.211 and peak error of 0.423. That is the data points are typically about 0.211 handicap strokes off the equation with the worst one being 0.423 off. The equation is:
Target*Proximity/(a*(Taget^2+Proximity^2))+Offset
a = 0.00667974738194226
Offset = -33.7821646031772
Would love to expand this out in the 10-60 yard target range and the 180-240 yard target range. If you know of any data let me know. The only data I know of is the ShotLink data from the PGA Tour. The average of the PGA Tour data seems to correlate to about a +6 Handicap in the Trackman data points. So I can use those data points in the wider target range for that handicap but I don't think it's very reliable to extrapolate out the higher handicaps in those ranges from just that.
Brian
Great article. I have a real life handicap of 10 and a SH of 5.7. I do lose a lot of shots putting though!!
ReplyDelete