Monday, 4 September 2017

Chrome Soft vs TP5 vs TP5X

Introduction
As previously stated I love the Callaway Chrome Soft and it is my normal ball. My previous testing has suggested (others have concluded similarly) that a premium ball is a premium ball and you should make your selection based on other factors such as cost, feel, colour etc.

The TP5/TP5X balls appear a little different. TM claim they launch higher with lower spin on full shots whilst maintaining the high spin character of a premium ball on shorter shots. If true this is really interesting.

For my skill level I get too much spin with a premium ball which increases the amount of curvature I get. If I could get a ball which exhibits consistently (wet vs dry etc) lower spin with longer shots it might help. An additional benefit of consistently lower spin would be better performance in the wind.

Hypothesis
TM claim the TP5 should launch higher with lower spin on longer shots. The TP5X should launch higher still with even lower spin and increased ball speed. Performance on short shots should be unaffected.

I have recently switched to CF16 irons in an attempt to reduce spin, is it possible the TP5/X balls will exhibit too little spin when paired with these irons?

Method
Within the limitations of my setup I tested by capturing 5 solid shots (not blatant mishits) with each ball and multiple clubs. Shots were struck from a soft range mat. Using this mat I have noticed shots launch higher and travel less distance compared to a firmer mat or turf. Spin rates are also higher and less variable than those encountered playing 'real' golf.

The balls were:
Callaway Chrome Soft
Taylormade TP5
Taylormade TP5X

The clubs were:
60° wedge (goal was a 50 yard pitch)
9 Iron (40°)
7 Iron (31°)
5 Iron (24°)
3 Iron (19°)
Driver (9.5°)

Results and Analysis

Subjective:
Nothing feels as soft as a Chrome Soft but the TP5 is noticeably softer than the X.
The TP5/X balls are also more clicky sounding.
During testing I noticed the TP5 ball initially seemed to get a little 'hairy'. This wore off after a few more shots and all of the balls appear durable. After completing my testing the Chrome Soft is in the best condition although the difference is minor.

Data:

60 Degree Wedge (Target 50 Yards):
Launch Angle was way higher with the TP5/X. I was hitting into a net and the launch angle was so steep I had to move my mat closer to avoid hitting the top!
 Spin rate was lower with the TP5/X, it averaged approx 1000rpm lower.


 9 Iron:
Launch Angle for the TP5 was similar to the chrome soft, but the TP5X launched significantly higher.
 Spin rates comparable.
 Average carry distance slightly longer for TP5/X.

7 Iron:
 Launch angle higher for TP5, higher still for TP5X.
 Spin rate comparable between Chrome Soft and TP5. TP5X substantially lower spinning.
 TP5 peak height > Chrome Soft. TP5X higher still.
 Carry distances similar.

 5 Iron:
 TP5X launches slightly higher.
 TP5 spin rate slightly lower than Chrome Soft. TP5X substantially lower.

 TP5X carry distance higher than Chrome Soft/TP5 by approx 5 yards.

3 Iron:
TP5X ball speed higher.
 TP5X launch angle > TP5.
 TP5/X spin rate < Chrome Soft.

 TP5/X carry distances longer than Chrome Soft.

Driver:
Ball speed highest with TP5X. Better than Chrome Soft by 3mph and TP5 by 2mph.
 Launch Angle highest with Chrome Soft (overridden by strike?)
 Spin rates comparable, controlled by strike.

 TP5X longer than Chrome Soft by 11 yards on average.


Raw data can be found here.


Do the TP5/X launch higher?
Yes, although most surprisingly with a 60deg wedge. In general the X launches higher than the 5.

Do the TP5/X spin less?
Yes, especially in the middle irons? On the 50 yard shots the TP5/X balls had a significantly lower spin rate

Is ball speed higher with the TP5/X
In the case of the X yes, but not by much.


Conclusion
The TP5/X are interesting balls; they actually appear to be doing something differently. They launch higher, spin less and travel slightly further. It is great to see TM taking a different direction with their ball design and I am keen to test these on course in the near future.


Update 07/09/17:
I have now managed to test on course and the results were interesting (and mostly subjective).

  • Off the tee I hit both balls, the TP5X went further on 4 occasions and the Chrome Soft went further on 3. 
  • When the TP5X was longest it tended to be by a greater amount than when the Chrome Soft was longest.
  • On approach shots the TP5X went further on 3 occasions.
  • Both balls appeared to stop equally well (distance between pitch mark and resting place).
  • The TP5X launched and flew visibly higher with iron shots. 
  • The TP5X appeared to be affected less by the wind.
  • The TP5X felt much harder than the Chrome Soft.

Strike is king. I believe the TP5X does behave differently to other premium balls, but fractional mishits vs flushed shots still count more than relatively minor differences between the balls.


Thursday, 4 May 2017

Chrome Soft vs Chrome Soft X

Introduction
I love the Callaway Chrome Soft, without doubt my favourite ball. The introduction of an X version meant I had to test it.

Hypothesis
This is an interesting one. My previous testing with premium balls and indeed other comparisons between these models suggests there will be no difference. However, Callaway claim the X version should fly lower and spin slightly more whilst feeling slightly firmer.

A excellent review here.
GolfWRX review here.

Method
Within the limitations of my indoor setup I tested by capturing 5 solid shots (not blatant mishits) with both balls and multiple clubs. Shots were struck from a soft range mat. Using this mat I have noticed shots launch higher and travel less distance compared to a firmer mat or turf. Spin rates are also significantly higher and less variable than those encountered playing 'real' golf.

The balls were:
Callaway Chrome Soft
Callaway Chrome Soft X

The clubs were:
LW (60°) (goal was a 36 yard pitch)
SW (52°) (goal was a 90 yard pitch)
6 Iron (29°)
3 Iron (21°)
3 Hybrid (21°)
2 Hybrid (18°)

Results and Analysis

Subjective:
The X ball is superb/weird. It felt very similar-slightly firmer to me but made a noticeable click compared to the duller thud of the normal chrome soft. I really like the click and soft feel of the X, but I also really like the thud and soft feel of the normal ball!

Data:
These are screenshots, the first club is the normal chrome soft, the second is the X.


As usual, raw data can be found here.

Does the X fly lower?
Not the way I hit it!

Does it spin more?
Technically I think it might a little; with the exception of the 36 yard pitch every single club did spin slightly more. However, I dont think a few hundred rpm of additional spin is going to affect my scores!

Conclusion
I think this was as expected. There may be differences between these balls if you are a tour player but as an amateur a premium ball is a premium ball. I would and will happily play either chrome soft model.

Next Steps
Once I get a setup capable of withstanding 3W/Driver shots repeat the testing.

Tuesday, 21 March 2017

Efficiency & Spin Axis

As someone who finds the maths and physics of Golf almost as interesting as playing I read and watch a lot in an attempt to improve my understanding. This led me to dig a bit deeper into my driver data, specifically efficiency and spin axis.

ST does not measure clubspeed it is calculated (with good accuracy). It measures ball speed with high accuracy. I therefore extracted my data and calculated bsCarryEfficiency, bsTotalEfficiency, csCarryEfficiency and csTotalEfficiency.

The PGA tour measures carry and total efficiency comparing clubspeed to carry and total distance.
For carry efficiency the 2017 range is 1.918-2.616, my average across my ST data is 2.4
For total efficiency the 2017 range is 2.391-2.936, my average across my ST data is 2.63
Fig 1
Figure 1 shows my bsCarryEfficiency distribution. The mean is 1.64, Q1 is < 1.6 and Q4 is > 1.69. It therefore seems reasonable to conclude anything at or above 1.69 is an efficient drive.

Having watched numerous youtube videos of various professionals I noticed a number of them were posting driver data with significantly greater carry distances than myself despite a similar or lower ballspeed. Spin rates and launch angle were similar so the distances should have been comparable. I therefore looked at other launch parameters and once again found myself looking into Spin Axis:
Fig 2
Figure 2 compares spin axis with ball speed carry efficiency for my driver data. PGA tour style carry efficiency would be better but I didnt want to rely on a calculation and using ball speed reduces (not eliminates) the effect of strike on the data. Within this data there is a curve (albeit with a low r2 value of .3397); increasing spin axis (left or right) generally reduces efficiency which makes sense. Using this data an efficienct drive requires a spin axis of +- 20deg (+-700rpm of side spin). My normal dynamic loft is 15.5deg so I need the face and path to be within 4.5deg of each other to hit an efficient drive (data taken from trackman university). The low r2 value will be the effect of strike and delivery, so you can have a low efficiency straight drive but you cant have a high efficiency crooked one (from the perspective of carry).

Skytrak, Trackman, GC2/GCQ
Going back to my youtube comment I decided to add some extra data; I added my trackman data from my recent Skytrak vs Trackman test, and manually captured data from youtube to see how the data compared. All of this data was produced on GC2/GCQ from various pros and also some amateurs:
Fig 3
Figure 3 shows the bsCarryEfficiency for Skytrak, Trackman and GC2/GCQ. Trackman shows a wider range which makes sense, it is measuring actual ball flight and there are lots of variables at play (open data). However, I think the GC2/GCQ data proves my observation that the youtube carry distances posted are significantly higher than ST and Trackman. This means for every mph of ball speed you put in a GC2/GCQ will likely calculate a more generous carry distance than a ST or a TM would observe.

Returning to Spin Axis
I then decided to reproduce the spin axis chart with the additional data and see how it compares:
Fig 4

Figure 4 shows the efficiency vs spin axis plot for the 3 data sets and I this this illustrates a few things:
1. The TM efficiency data is comparable to ST except the spin axis values are generally smaller. This was already noted in previous testing.
2. The range of spin axis measurements for ST and GC2/GCQ are comparable (more extreme than TM) so perhaps the ST isn't exaggerated compared to GC2/GCQ? Much more data would be required to prove this.
3. The GC2/GCQ is significantly more generous in its carry calculation, to the tune of 10 yards at my average ball speed of 155mph.

Thursday, 9 March 2017

Flightscope Trajectory Optimizer - Launch Angle

http://flightscope.com/products/trajectory-optimizer/

This is a great tool and I use it frequently to assess my launch conditions against a different flight model (Flightscope instead of Skytrak or Trackman), and also to experiment with different parameters so I can analyse how they affect distance.

I launch my driver quite high, on average between 14.5-16 degrees. Trackman suggests the optimum for my ball speed is closer to 13 degrees so I wanted to assess the impact and it turns out the results are quite interesting.


The coloured columns are carry, total (hard), total (soft).
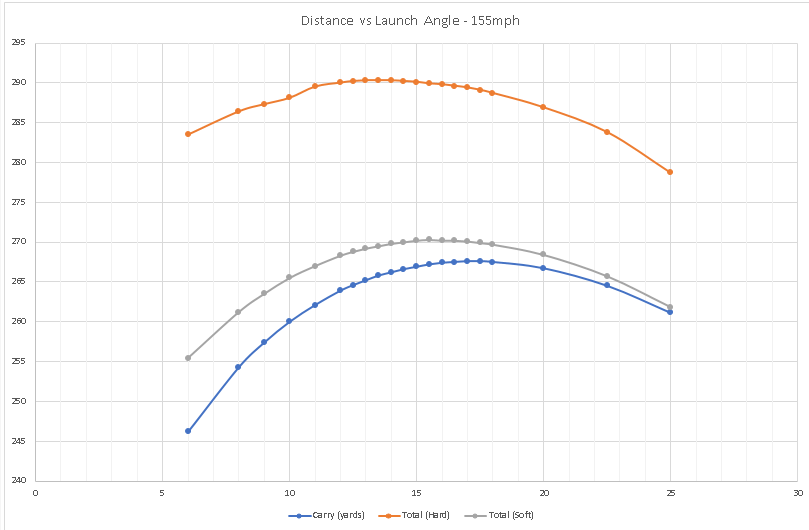
This suggests high launch is not a big issue, and strongly indicates it is better to err on the side of launching too high vs too low. According to this launching at 17deg is optimum for carry, but even launching at 25deg will only cost you 6.5 yards of carry and approx 10 yards of total distance in hard conditions. Conversely reducing launch angle to 9 degrees will cost you 10 yards of carry. From this point carry distance drops rapidly with decreasing launch.

N.B. the dip in the curve for total (hard) at 10 degrees launch.

133mph ball speed
I thought it might be interesting to compare this with a lower ball speed (the average ball speed of player a from our Skytrak vs Trackman test).

A similar pattern emerges and optimum launch increases to a whopping 20-22deg. How many amateurs launch their driver at 20-22deg???

The dip in the curve for 10deg launch is much more pronounced. Not sure what this indicates???

Friday, 3 March 2017

Skytrak vs Trackman Pt 2 - Shot by shot Player A

Introduction
After the first part I wanted to try and illustrate the data captured on a more blow by blow basis so this is that attempt; this will therefore be a very chart heavy! Each chart shows the Skytrak and Trackman data, aligned shot by shot.

This is the actual Trackman data with no normalisation. Differences in calculations from the ST flight model should therefore be expected (but I still expect it to follow the measured data (e.g. short shot = short shot etc).

Summary data is useful but I think the below shot by shot charts illustrate just how accurate the ST is.

Ball Speed

I think this is highly impressive and shows excellent correlation between both systems. The difference is normally negligible peaking at approx 7.7mph in the worst case.

Club Speed
As a calculated parameter this is surprisingly close to the measured Trackman value.


Vertical Launch


Horizontal Launch


I think this shows the subtle difference in alignment between the 2 units. If you subtract approx 1.5 deg (turn the ST 1.5deg left) they match even more closely. I do not believe these 1.5deg affect the spin axis measurement but they do affect the offline projection.

Total Spin

I think this is the most impressive chart of all, Skytrak can measure spin rate with phenomenal accuracy. It is this which makes me think the Spin axis deduction is not calculating as expect (as opposed to capture). The sizeable deviations are caused by Trackman not returning total spin.

Spin Axis

As previously noted this is the only troublesome measured parameter. I think this chart clearly shows the Skytrak is measuring Spin axis (I would even say accurately) but for this player it is predominantly skewed in a negative direction. For myself (Player B) I am pretty sure we will see the reverse (skewed positively) because our shot shapes are opposing.

Flight Duration

A calculated parameter for Skytrak. This is impressively close considering we were hitting range balls with a slightly reduced distance.

Descent Angle
A calculated parameter for Skytrak, impressively close to Trackman for the majority of shots.

Peak Height

A calculated parameter for Skytrak, impressively close to Trackman for the majority of shots.

Smash Factor

A calculation based on a calculation so potentially risky. However, it seems impressively close to the Trackman value. 

Offline


As previously noted the wind was slightly helping and from the right. You would therefore expect the ST shots to finish right of the actual TM shots? However, if you take into account the circa 1.5deg alignment difference between the units (ST alignment approx 1.5deg right of TM target) I think these are almost identical.

Carry Distance

Carry distance looks spot on considering they were range balls.
Total Distance

As before total distance also tracks as you would expect (for a range ball).

Skytrak vs Trackman Part 1

I recently conducted some testing to compare my Skytrak to Trackman. I have read a number of comparisons (mainly by golf magazines etc) but none of them come across as very rigorous and they didn't share complete data so that others can peer review/scrutinise.

The objective of this testing was simple, assess the accuracy of my Skytrak against the industry standard Trackman and present full results so others could peer review.

Method
Myself and a playing partner hit balls with a variety of clubs collecting the raw data from both systems.
The balls were range balls (I will cover this later), but they were high quality srixon range balls. In Trackman ball conversion terms they are the equivalent of hard (reduced spin with short irons, elevated spin with long irons/woods).
The weather was excellent (for Scotland in Feb!), approx 6C with a light wind helping slightly from the right.
Skytrak software version was 2.5.4 on and Ipad Air 2.
Trackman 3 in Outdoor mode.

Results (Player A)
Source Data Link


These are the results averaged across all shots and shows excellent correlation across the data except spin axis/side spin. This leads to reduced accuracy for the offline figure. However, I think it is important to remember this is range ball data hitting outside so this is comparing what actually happened to the ball vs the Skytrak flight model. 

Initial Thoughts
  • My Skytrak behaved impeccably throughout this test. Trackman missed 1 shot whilst we were setting up, and Skytrak missed 2 shots during this test. I think this was down to my playing partner hitting the followup ball too quickly.
  • Trackman frequently missed spin data (you can see some of this in the detail worksheet). Skytrak did not miss once, and the results match so closely I found myself trusting the Skytrak data over the Trackman (The trackman spin numbers appeared to fluctuate more).
  • Some people have complained about the delay on Skytrak. For plenty of the longer shots we found ourself waiting for Trackman to finish tracking the ball and present its full data rather than the Skytrak!

Horizontal Launch
This was one measurement I expected to vary because of differential alignment between the systems. Despite this I believe the Skytrak data is very accurate and consistent. The spec for Skytrak is 2Deg and it was within this tolerance.

Spin Axis
The spin axis seems to be exaggerated frequently leading to excessive curvature on shots. My initial response on witnessing this was the Skytrak struggling to read/calculate the side-spin component accurately.  However, given the accuracy of the total spin (or backspin component) and horizontal launch angle it seems highly improbable the raw data capture was to blame. It therefore seems likely there is something weird in the way that raw data is converted into spin axis.

I raised this issue with support and was advised to reinstall the Skytrak software which I have done. At some point I will need to retest and see if the spin axis is captured more accurately.

Conclusion
With the exception of the Spin axis phenomenon described above I was surprised by how closely my Skytrak matched the Trackman data. I think the important parameters (ball speed, v-launch, h-launch, total spin) were measured with highly impressive accuracy especially when you consider the cost differential (2k vs 25k) and the fundamentally different ways in which these units operate.

I will also say that I couldn't use a Trackman at home due to its space requirements, but if I wanted an outdoor ball tracking device and cost wasn't a factor I would definitely have one. The Trackman software is phenomenal and the amount of data it captures with unerring accuracy is amazing. When conditions allow there is no substitute for measuring what actually happened vs what should have (even though the latter is very accurate!). It is the benchmark.


Next Steps

  • Try to summarise across all clubs, shot by shot.
  • Player B data.
  • Open pandora's box and delve into some of the raw Trackman data!
  • Experiment with normalisation and see how that affects the data!
  • Examine some individual shots.
  • Find a GC2/GCQ to test against!


Thursday, 16 February 2017

Skytrak Skills Assessment vs Trackman Combine

Tracking shots is great and provides a wealth of data. However, the Trackman Combine test makes you focus on a target and puts you under pressure. I think it is a brilliant practise aid so the ability to complete something similar on Skytrak was a significant factor for me before I purchased it.

Having completed several Trackman Combine tests and plenty of Skytrak SA (Skills Assessment) I thought it would be interesting to see how they compare.

Trackman presents you with various targets (60, 70, 80, 90, 100, 120, 140, 160, 180, Drive). All targets are based on carry distance and based on proximity to the target you are given a score out of 100. They than map the score to a handicap based on real data collected from people completing the combine test.
http://blog.trackmangolf.com/performance-of-the-average-male-amateur/
http://mytrackman.com/media/5df25dca-3bc5-41b5-bca8-c3badebdd3b7/content/5_
https://mytrackman.com/media/9e613e61-a366-49cf-8b6f-26c9809c1fc9/CWsVnw/PDF/1.%20TrackMan%20Golf/2.%20Combine/TrackMan-Combine-brochure.pdf

Trackman does not show the calculated handicap for an individual shot.

Skytrak SA is similar although the distances are based on Total Distance as opposed to carry. If you are using Premium balls and hit the ball consistently your spin rate will be high enough for the difference to be negligible (the ball will stop dead or spin back slightly on the Skytrak Green). Each shot is assigned a dynamic handicap based on proximity to the target.

Having completed 3 combine tests and numerous SA's it is immediately apparent the SA is way more punishing for my ability. My combine scores have ranged between 70-78 which places my Trackman handicap between 0-4. My SA scores have placed me between 5-13.

I therefore set about comparing proximity to calculated handicap to see what patterns emerge:


Some very clear patterns emerge:

  • Skytrak uses a linear equation to calculate handicap from proximity to target.
  • Trackman uses a quadratic equation to calculate handicap from proximity to target.
  • Skytrak and Trackman roughly agree in the 18-20 handicap range.
  • Below 18 Skytrak becomes increasingly punishing compared to Trackman.
  • Above 20 Skytrak becomes increasingly lenient compared to Trackman.

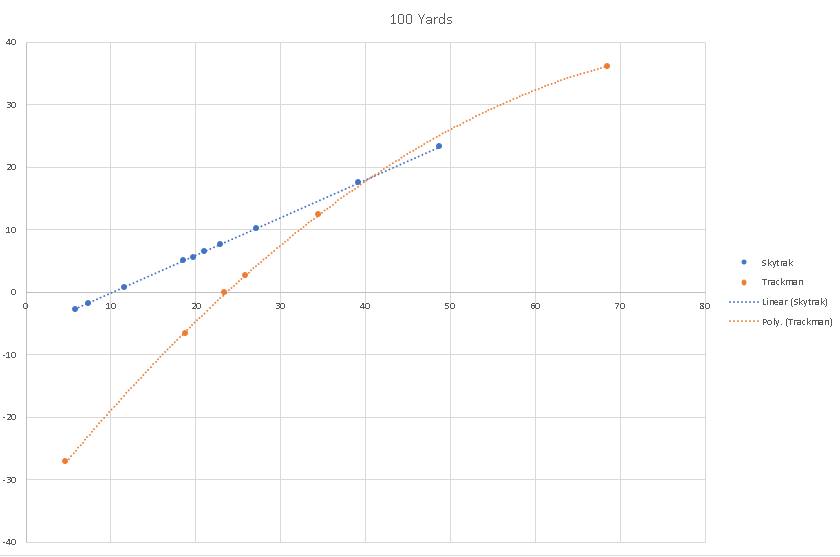
The following chart compares proximity to handicap at varying distances.
From this it becomes even clearer how punishing Skytrak is to better scores. A male scratch golfer will on average score 72 on trackman. He will score a dynamic handicap of approx 8-9 on Skytrak! Because the handicaps converge in the 18-20 region it seems logical the handicap region between 8 and 20 is compressed on Skytrak compared to Trackman (12 handicap units vs 20). This means a 1 shot improvement between 8-20 equates to a real world improvement >1 shot. It also means attaining a 1 shot improvement <8 Sh Hcap becomes exponentially harder compared to Trackman and thusly real life. The Sh Hcap is still in beta (as of 2.5.4) so in my opinion it seems sensible to adjust the algorithm to take this into account.

Conversion
Using this data and excel it is possible to ascertain conversion equations between the systems:
Th - Trackman Handicap
Ts - Trackman Score
Sh - Skytrak Handicap

Trackman Handicap from Trackman Score
Th = -0.0052Ts2 - 0.1572Ts + 38.226 (r2=0.9952)

Skytrak Handicap from Trackman Handicap
Sh = 0.0077Th2 + 0.4029Th + 8.5378 (r2=0.995)

Trackman Handicap from Skytrak Handicap
Th = -0.0254Sh2 + 2.5073Sh - 19.453 (r2=0.9932)