Thursday, 16 February 2017

Skytrak Skills Assessment vs Trackman Combine

Tracking shots is great and provides a wealth of data. However, the Trackman Combine test makes you focus on a target and puts you under pressure. I think it is a brilliant practise aid so the ability to complete something similar on Skytrak was a significant factor for me before I purchased it.

Having completed several Trackman Combine tests and plenty of Skytrak SA (Skills Assessment) I thought it would be interesting to see how they compare.

Trackman presents you with various targets (60, 70, 80, 90, 100, 120, 140, 160, 180, Drive). All targets are based on carry distance and based on proximity to the target you are given a score out of 100. They than map the score to a handicap based on real data collected from people completing the combine test.
http://blog.trackmangolf.com/performance-of-the-average-male-amateur/
http://mytrackman.com/media/5df25dca-3bc5-41b5-bca8-c3badebdd3b7/content/5_
https://mytrackman.com/media/9e613e61-a366-49cf-8b6f-26c9809c1fc9/CWsVnw/PDF/1.%20TrackMan%20Golf/2.%20Combine/TrackMan-Combine-brochure.pdf

Trackman does not show the calculated handicap for an individual shot.

Skytrak SA is similar although the distances are based on Total Distance as opposed to carry. If you are using Premium balls and hit the ball consistently your spin rate will be high enough for the difference to be negligible (the ball will stop dead or spin back slightly on the Skytrak Green). Each shot is assigned a dynamic handicap based on proximity to the target.

Having completed 3 combine tests and numerous SA's it is immediately apparent the SA is way more punishing for my ability. My combine scores have ranged between 70-78 which places my Trackman handicap between 0-4. My SA scores have placed me between 5-13.

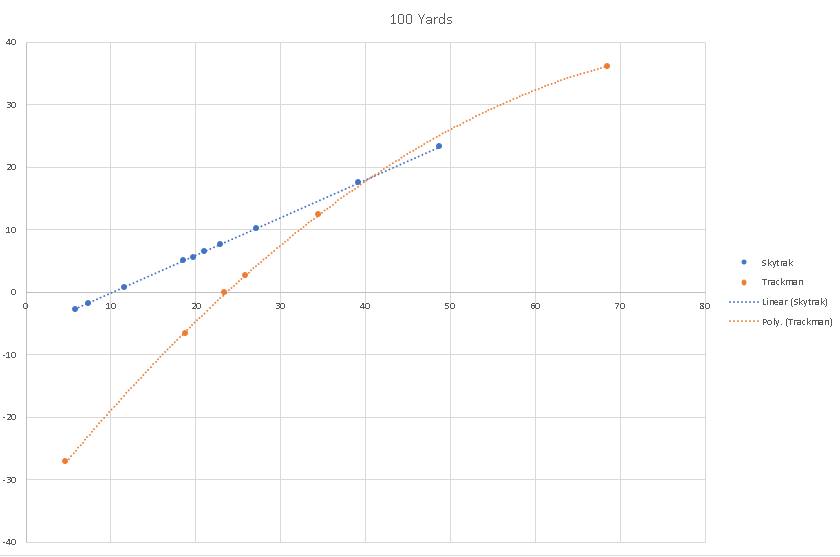
I therefore set about comparing proximity to calculated handicap to see what patterns emerge:


Some very clear patterns emerge:

  • Skytrak uses a linear equation to calculate handicap from proximity to target.
  • Trackman uses a quadratic equation to calculate handicap from proximity to target.
  • Skytrak and Trackman roughly agree in the 18-20 handicap range.
  • Below 18 Skytrak becomes increasingly punishing compared to Trackman.
  • Above 20 Skytrak becomes increasingly lenient compared to Trackman.

The following chart compares proximity to handicap at varying distances.
From this it becomes even clearer how punishing Skytrak is to better scores. A male scratch golfer will on average score 72 on trackman. He will score a dynamic handicap of approx 8-9 on Skytrak! Because the handicaps converge in the 18-20 region it seems logical the handicap region between 8 and 20 is compressed on Skytrak compared to Trackman (12 handicap units vs 20). This means a 1 shot improvement between 8-20 equates to a real world improvement >1 shot. It also means attaining a 1 shot improvement <8 Sh Hcap becomes exponentially harder compared to Trackman and thusly real life. The Sh Hcap is still in beta (as of 2.5.4) so in my opinion it seems sensible to adjust the algorithm to take this into account.

Conversion
Using this data and excel it is possible to ascertain conversion equations between the systems:
Th - Trackman Handicap
Ts - Trackman Score
Sh - Skytrak Handicap

Trackman Handicap from Trackman Score
Th = -0.0052Ts2 - 0.1572Ts + 38.226 (r2=0.9952)

Skytrak Handicap from Trackman Handicap
Sh = 0.0077Th2 + 0.4029Th + 8.5378 (r2=0.995)

Trackman Handicap from Skytrak Handicap
Th = -0.0254Sh2 + 2.5073Sh - 19.453 (r2=0.9932)


Tuesday, 31 January 2017

Wet Ball Testing

Update 06/02/17:
I would love somebody to peer review/verify my results...

Having had my Skytrak for a few weeks I have noticed a strange phenomenon when practising at the driving range which I also observed last year on Trackman:
During my Trackman practise I would sometimes observe significant distance differences from one session to another. At the time I thought it might be local weather conditions; a strong headwind reducing distances some days and not others. During each session the wind didnt feel overly strong but distances varied significantly.
My first range session with my skytrak produced a similar distance deviation; I was hitting short-middle irons approx 1-2 clubs longer than normal. When I started looking at the data it became clear the spin rate was significantly lower than expected, not higher as I have typically found with range balls. At the time my teaching pro said it was probably because the balls were wet but I didnt appreciate the difference it made so I set about testing this.

Please see my previous post for the dry ball data here.

Research
This seems to be a poorly studied area with relatively little information available:
http://blog.tourspecgolf.com/wet-versus-dry-golf/
http://www.andrewricegolf.com/andrew-rice-golf/2013/02/wedges-and-water
http://blog.trackmangolf.com/the-difference-in-range-ball-distances/


Hypothesis (largely taken from dry ball testing)
Spin rate will be reduced. Spin rate will be higher with premium balls and lofted clubs.
Distance is largely the same across different ball types but it will be higher when the ball is wet due to reduced spin.

Method

Within the limitations of my indoor setup I tested by capturing 5 solid shots (not blatant mishits) with 4 balls and three clubs. Shots were struck from a soft range mat. Using this mat I have noticed shots launch higher and travel less distance compared to a firmer mat or turf. I dropped each ball into a pot of water prior to hitting.

The 4 balls were:
Titleist Pro V1x
Callaway Chrome Soft
Titleist DT Trusoft
Callaway Supersoft

The clubs were:
PW (46.5°)
7 Iron (33°)
5 Iron (26°)


Results and Analysis

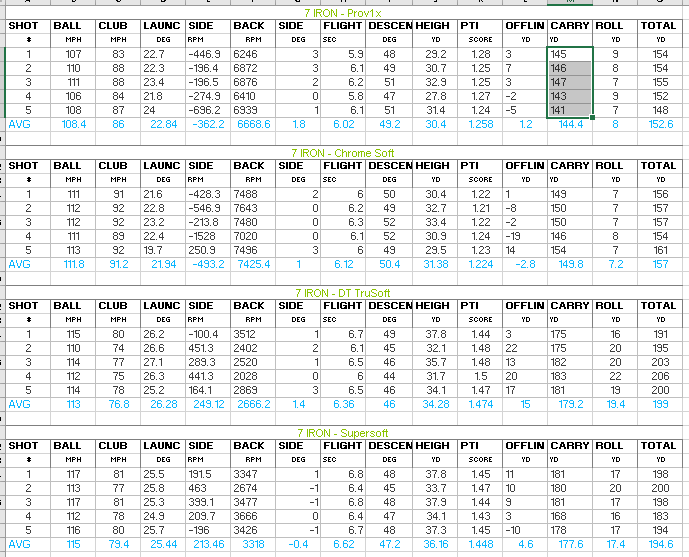
The results shocked me:

A 74% reduction in spin rate between premium and non-premium ball with a PW.

A 21% increase in carry distance (31 yards) between premium and non-premium ball with a 7 iron.


I was expecting to see a difference, but not of this magnitude. That is almost 3 clubs of difference with a 7 iron, not to mention the additional rollout you would get on landing (42 yards in my Skytrak data).

This analysis took several attempts to capture because the quantity of water needed to decimate spin was miniscule. When I first ran the testing I tried to do 1 ball at a time, running dry then wet testing with each ball. I started with 2 premium balls so all was fine and results were inline with expectation. However, I couldn't get dry ball results from the two non-premium balls because there was water on my hitting area (the castoff water) which led to a film of water on the club and low spin flyers. I continued hitting for some time (30-40 shots) but it was never dry enough to replicate proper dry results.

Conclusion

  • If you hit the ball reasonably well and play in anything other than a desert use a premium ball. If you dont you risk hitting flyers frequently (even from the fairway).
  • A tiny amount of water interacting with a non-premium ball can decimate spin.
  • A premium ball is largely immune to this phenomenon; presumably because of the softer cover material which allows the grooves to bite.
  • The difference seems greatest with a medium iron.


Supporting Data


Monday, 30 January 2017

Does Height Matter Pt 2?

I want to make this process as scientific as possible so after feedback from another user I have rerun the testing with a LW. Part 1 can be found here.

Hypothesis and method are the same as part 1.

Results and Analysis

Source Data (Excel)

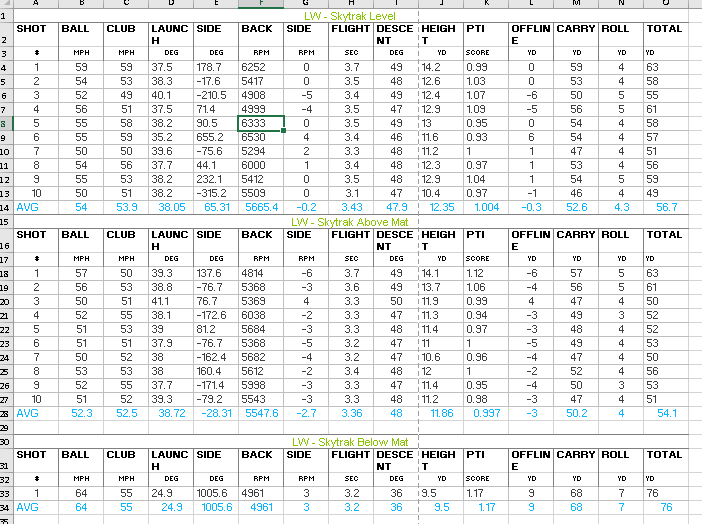
Once again the data doesn't vary with Skytrak height. However, with a high launching club and the Skytrak in a low position the cameras must miss some/all of the ball flight. Of my 10 test shots the only one which registered was a thin. It failed to detect all other shots.

When I originally tested with a 7 iron I was looking for variance in the data produced (e.g. launch angle, spin etc) and I did not see this at any stage. Nor do I see evidence of this in the LW data.

I think based on this it is possible to predict that a low launching club (e.g. 3W) could suffer non-reads if the Skytrak was too high. To run this test I need to be brave enough to swing a 3W in my garage!

Guidance:
Based on the above and previous experiment I think it is possible to make the following recommendations:
  1. If you suffer non-reads with a lofted club the Skytrak is probably too low. Raise the Skytrak by 25mm and try again.
  2. If you suffer non-reads with a low-lofted club the Skytrak is probably too high. Lower the Skytrak by 25mm and try again.

Friday, 27 January 2017

Does height matter?

I have seen a few comments about getting the Skytrak at exactly the same height as the ball for accurate readings so I decided to test it.

Hypothesis
Varying the height of the Skytrak relative to the ball will alter the readings produced.

Method
Hit 10 shots with the Skytrak approximately level with the mat.
Hit 10 shots with the Skytrak approximately 30mm above the mat.
Hit 10 shots with the Skytrak approximately 30mm below the mat.

The Skytrak protective case was used.

Results and Analysis
It looks to me like there is little difference in the results with a fairly significant deviation in the height of the Skytrak (60mm high-low).

Controlling Trajectory Pt 1

I practise at the range and try to randomise my practise but before I had a Skytrak I had no way of measuring what was happening (beyond hitting shots in the right direction) so I would end up hitting normal shots . I would then play golf and have numerous shots into the wind where I needed to lower the trajectory. I would follow the normal process of using more club, moving the ball back, taking more club and trying to swing smoothly. However, I would inevitably hit the ball harder with greater spin loft which would result in the ball trying to reach orbit and coming up well short. This was therefore something I wanted to start testing once I got my Skytrak.

Hypothesis
  • Trajectory will be lower.
  • Combined with higher spin rate will lead to reduced carry distance.
Method
I initially set about testing this by hitting 8 irons, aiming to get 10 solid shots. This highlighted problem 1; it was fairly easy to get 10 solid normal shots but because I dont practise punch shots enough my strike was all over the place. I ended up hitting 17 shots.

Results and Analysis

Looking at the above it is clear the trajectory was lower. Launch angle was almost 4deg less and peak height was 6 yards lower which is significant. As expected descent angle was also lower, but the difference was much smaller.


The detailed trajectory chart is interesting:
It doesnt show up well because Skytrak picked grey for the normal shots, but it is much clearer in this chart how the trajectory was significantly lower. It is also clear how much greater my dispersion was (especially front-back).

Looking back to the hypothesis the trajectory was indeed lower, significantly so. However, the spin rate was not higher and the carry distance was shorter due to strike inconsistencies.

Next Steps
  1.  Repeat this testing with more clubs and improve strike consistency to see if the data remains consistent. 
  2. Attempt to hit to set distances with less lofted clubs (e.g. a 5iron 150 yards carry). What does its trajectory profile look like and is the 'use more club' mantra technically correct but easy to underestimate? Effectively build a distance chart for low trajectory (and preferably low spin shots).
  3. Test with differing wind settings on Skytrak to start being able to estimate shots into/with the wind more accurately.

Dry Ball Testing

This is my third attempt at documenting this analysis because it threw up issues each time I tested; something which should have been easy to test!

Hypothesis
  • Distance is largely the same across different ball types.
  • Spin rate will be higher with premium balls and lofted clubs.
Method

Within the limitations of my indoor setup I tested by capturing 5 solid shots (not blatant mishits) with 4 balls and three clubs. Shots were struck from a soft range mat. Using this mat I have noticed shots launch higher and travel less distance compared to a firmer mat or turf.
The 4 balls were:

  1. Titleist Pro V1x
  2. Callaway Chrome Soft 
  3. Titleist DT Trusoft
  4. Callaway Supersoft
The clubs were:

  1. PW (46.5°)
  2. 7 Iron (33°)
  3. 5 Iron (26°)


Results and Analysis
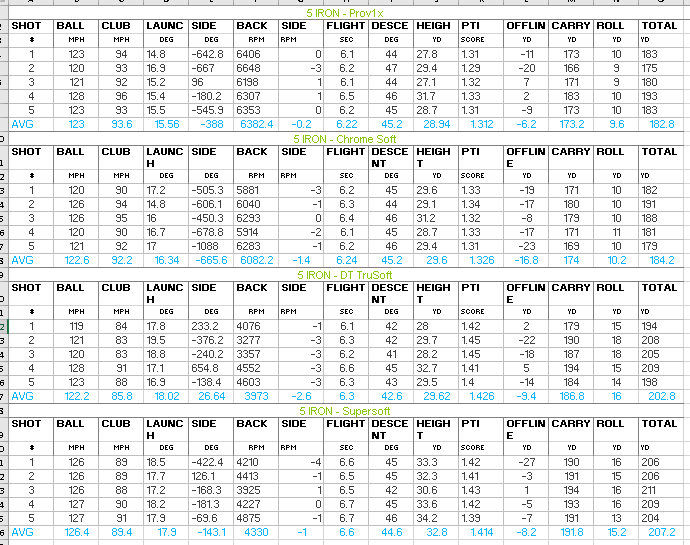
Distance was similar especially when ball speed was taken into account:
Spin Rates were roughly inline with expectation, although the DT Trusoft was surprisingly high spinning with a PW.

Looking at the data the Prov1x was slightly lower spinning and slightly shorter than the other balls. At the time of testing I thought this was because it was the first ball in each set. However, as I am now discovering testing indoors (and not losing golf balls) is extremely punishing on golf balls. A day after this data was collected the Prov1x started showing very low ball speeds and shortly after this it sounded strange. Upon inspection I noticed the ball had fractured!

The wet ball testing is where things get interesting...


Supporting data:


Wednesday, 25 January 2017

Monte Carlo Part 2

The next step for my monte carlo POC was to integrate some course data into it.
Sample excel file here:
Link
The first worksheet is the same as before, and the third is a reference file for strokes gained data.

The middle worksheet will allow you to enter course data and then using the simulated data test the safety of your strategy. Columns requiring input are green. Calculated outputs are yellow. To test it out you will need to get some metrics from a course planner or Google Earth.

Hole - Self explanatory.
Start Yardage - Self explanatory.
Safe Width Yards - Using your mean distance data from the dispersion sheet use google earth to measure the safe width at this point from the tee.
Club - Self explanatory.

From this data it will calculate the number of shots predicted to be unsafe to the left and right followed by the number predicted to be safe. If your aim is to be safe on >17/18 holes you will need to aim for >95% safety. In practise I have accepted 84% for hole 1 because in real life it is a par 5 and unsafe rarely means a situation where the ball cannot be advanced far enough to reach the green in 3. Conversely, hitting driver means I can easily reach the green (at least in distance terms) >80% of the time.

In the example data based on my distance and dispersion 2H on hole 1 will be safe 99.9% of the time vs 83.7% for driver. However, my SG would be -0.05 with 2H vs 0.21 with driver.

For hole 3 in the example data 2H makes sense. The safe zone narrows significantly with increasing distance leading to a high percentage of unsafe driver shots (approx 34%) vs a high safety margin with 2H (approx 98% safe).

This model is highly limited but last year I was struggling with my strategy on a number of tee shots. Using this data I realised I was hitting driver when I shouldn't and the result was lots of unsafe shots with little to be gained by hitting it further. Switching to the optimal club (I enhanced the spreadsheet to allow for 5 clubs off the tee (model the data, copy the rows) reduced my average score on 1 particular hole by 0.4 shots!