Continuation from part 1
Results and Analysis
I don't have a great deal of interest in the distance data captured by the devices. I know my distances very accurately due to extensive time on Skytrak, Trackman and GCQ. I am however interested in what insights the devices offer so the rest of this post will delve into this...
Overview
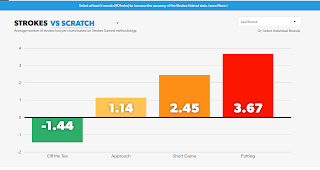
MRP aces this, it is immediately obvious where strengths and weaknesses lie. It has a good selection of Strokes Gained (SG) baselines and I have manually verified the accuracy of the calculation.
GG is ok, but the data is rather crude and because there is no strokes gained drilldown you cannot verify accuracy or dive into the details. It does have a selection of strokes gained baselines.
SS doesn't currently have an overview screen. This seems like a substantial shortcoming.
Driving
Results and Analysis
I don't have a great deal of interest in the distance data captured by the devices. I know my distances very accurately due to extensive time on Skytrak, Trackman and GCQ. I am however interested in what insights the devices offer so the rest of this post will delve into this...
Overview
 |
| MRP Overview |
 |
| GG Overview |
GG is ok, but the data is rather crude and because there is no strokes gained drilldown you cannot verify accuracy or dive into the details. It does have a selection of strokes gained baselines.
SS doesn't currently have an overview screen. This seems like a substantial shortcoming.
Driving
 |
| I didnt hit a shot into a hazard, but according to MRP I did! |
MRP is clear in terms of SG by club but the interface is clunky and you need to click buttons to swap clubs. It only allows Driver, 3W and other as categories. You cannot hover over the dots to see where/when shots were taken.
GG focuses on distance, no reference to SG. You can hover over the dots to see which hole/course/round it was captured which is excellent. The display can be filtered by any combination of club/round etc. Unfortunately the display is meaningless, hitting or missing fairways doesn't really matter as proven by SG.
SS has huge potential. It shows distance and dispersion but it also shows score (par, birdie etc) so over time you will start to see where your costly misses are. Hovering over a dot provides extra information and click-through to the actual shot! What would massively improve the visuals would be the distance and accuracy grids to colour the dots based on result to par and even better some kind of SG heatmap. It makes no reference on SG which makes interpreting the data somewhat challenging.
Part 3 will cover Approach, Short game and Putting.


No comments:
Post a Comment
Note: only a member of this blog may post a comment.